
No products in the cart.
Measure ROI with analytics on the effectiveness and impact of training
Visualize learning KPIs individually and at a group level, to help you evaluate performance, outcomes and take action.
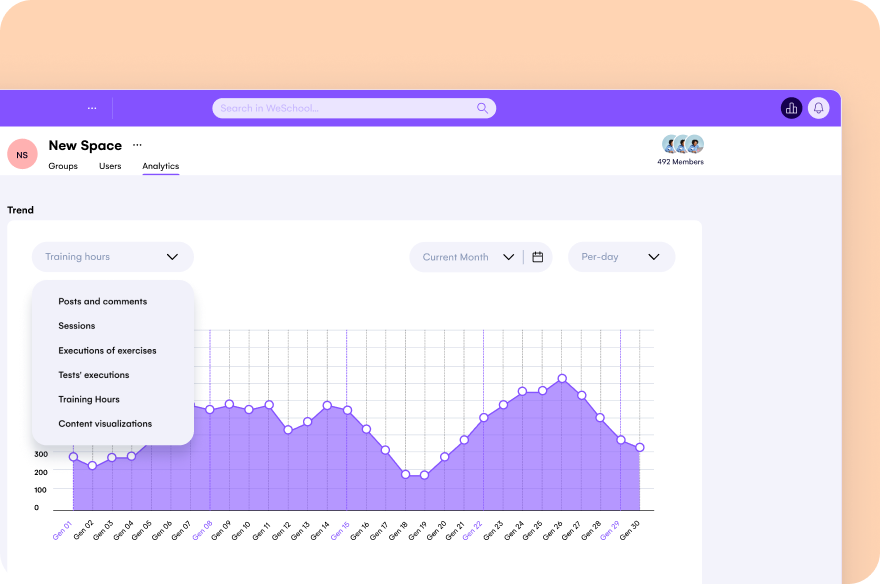
Visualize data to identify areas of improvement
Spot trends, engagement peaks and areas of improvement with a dynamic graph. Understand when users or groups are most engaged with training materials and other group members.
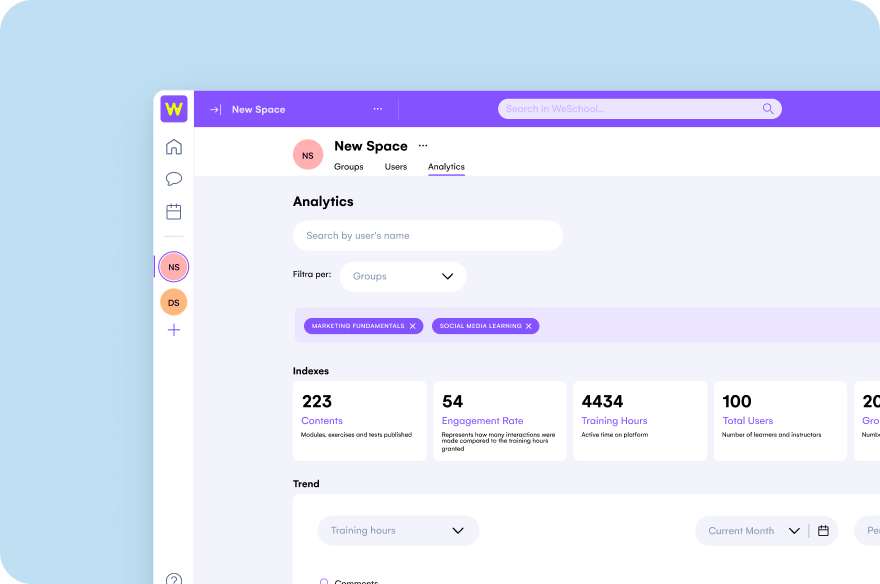
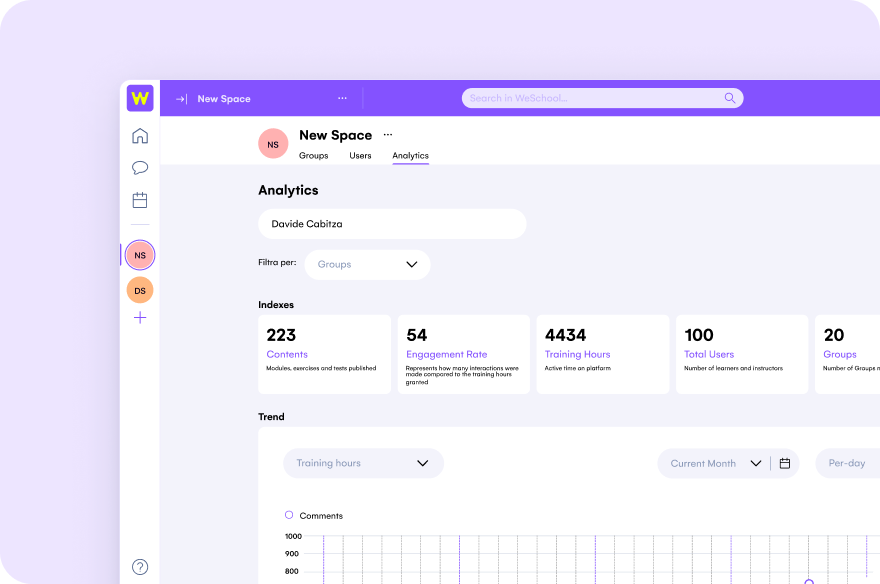
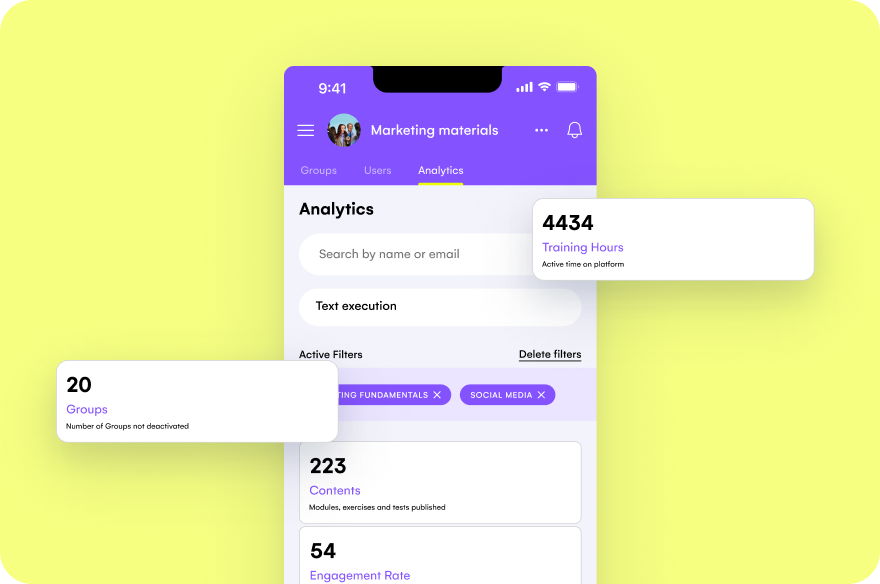
Analyze what you need at a granular level
View the analytics of several groups or individual learners to understand training effectiveness. Then select the time period and trends you’re interested in: from the number of sessions, training hours, posts and comments, completed assignments or visualized contents.
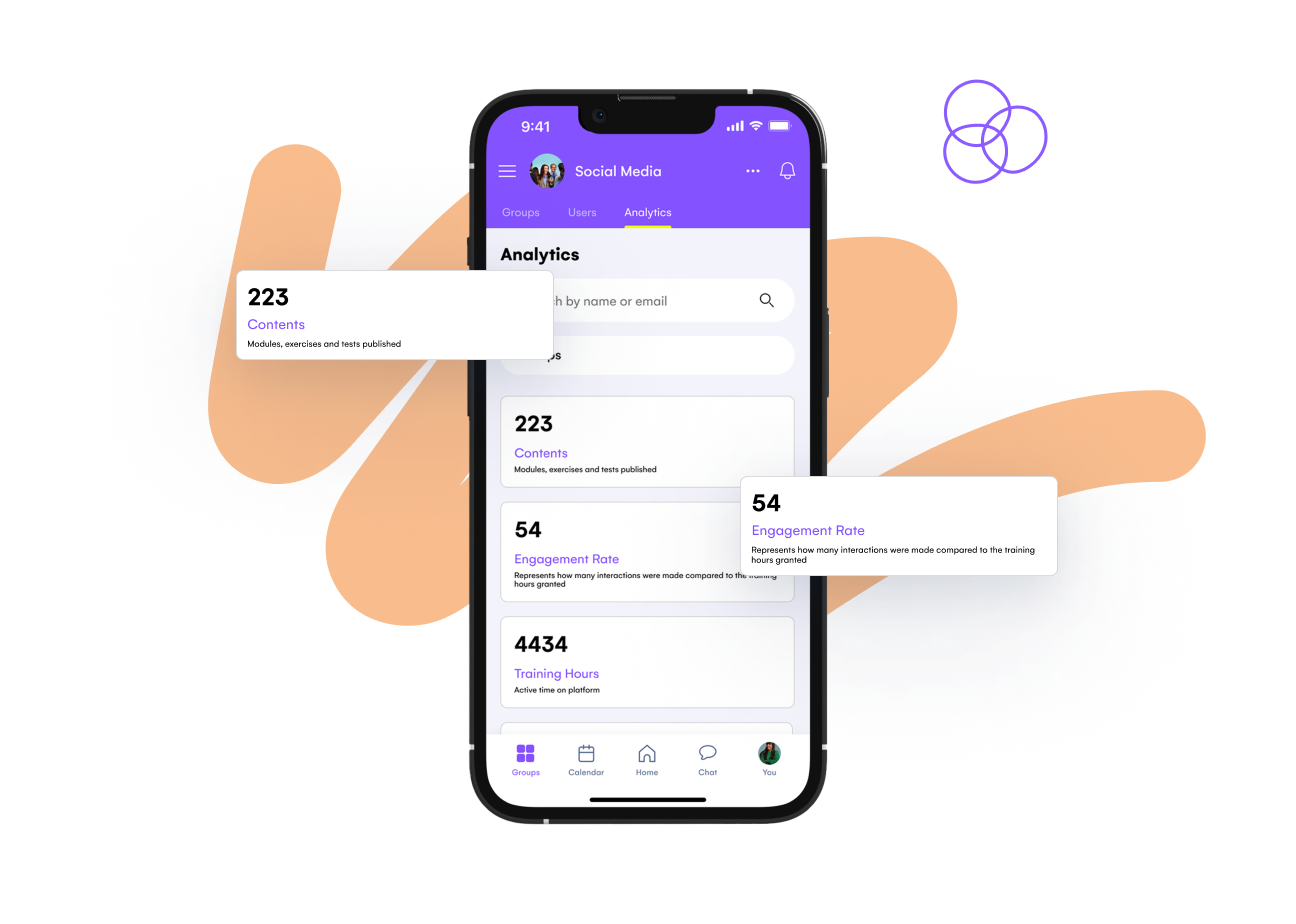
Measure social learning across groups
See your group’s overall engagement rate based on the number of interactions made in comparison to the number of training materials delivered. Then use these feedback loops to adapt learning paths to be even more engaging.
Relate learning outcomes to ROI
Prove the value of your courses by establishing a clear link between improvements in key business metrics and the performance of your learners.
See how WeSchool helps you deliver better learning experiences
GUIDE & CREATE


ENGAGE & SUPPORT


GUIDE & CREATE
ENGAGE & SUPPORT
Ready to get started?
Explore our full learning platform with a 14-day free trial, no credit card required. Create training experiences and engage users without being a learning expert, all in one place.